Julian Straub
creations and thoughts
Arduino Solar Cell Characterization
As shown in the previous post about stabilizing the voltage of a solar
cell, solar cells have a
characteristic U-I operating curve as shown below. Since the power output is
determined by
\(P=U I\)
, understanding and managing the operating point is
important to efficient operation and power extraction. Maximum power point
trackers (MPPT), are design to track the point of maximum power.
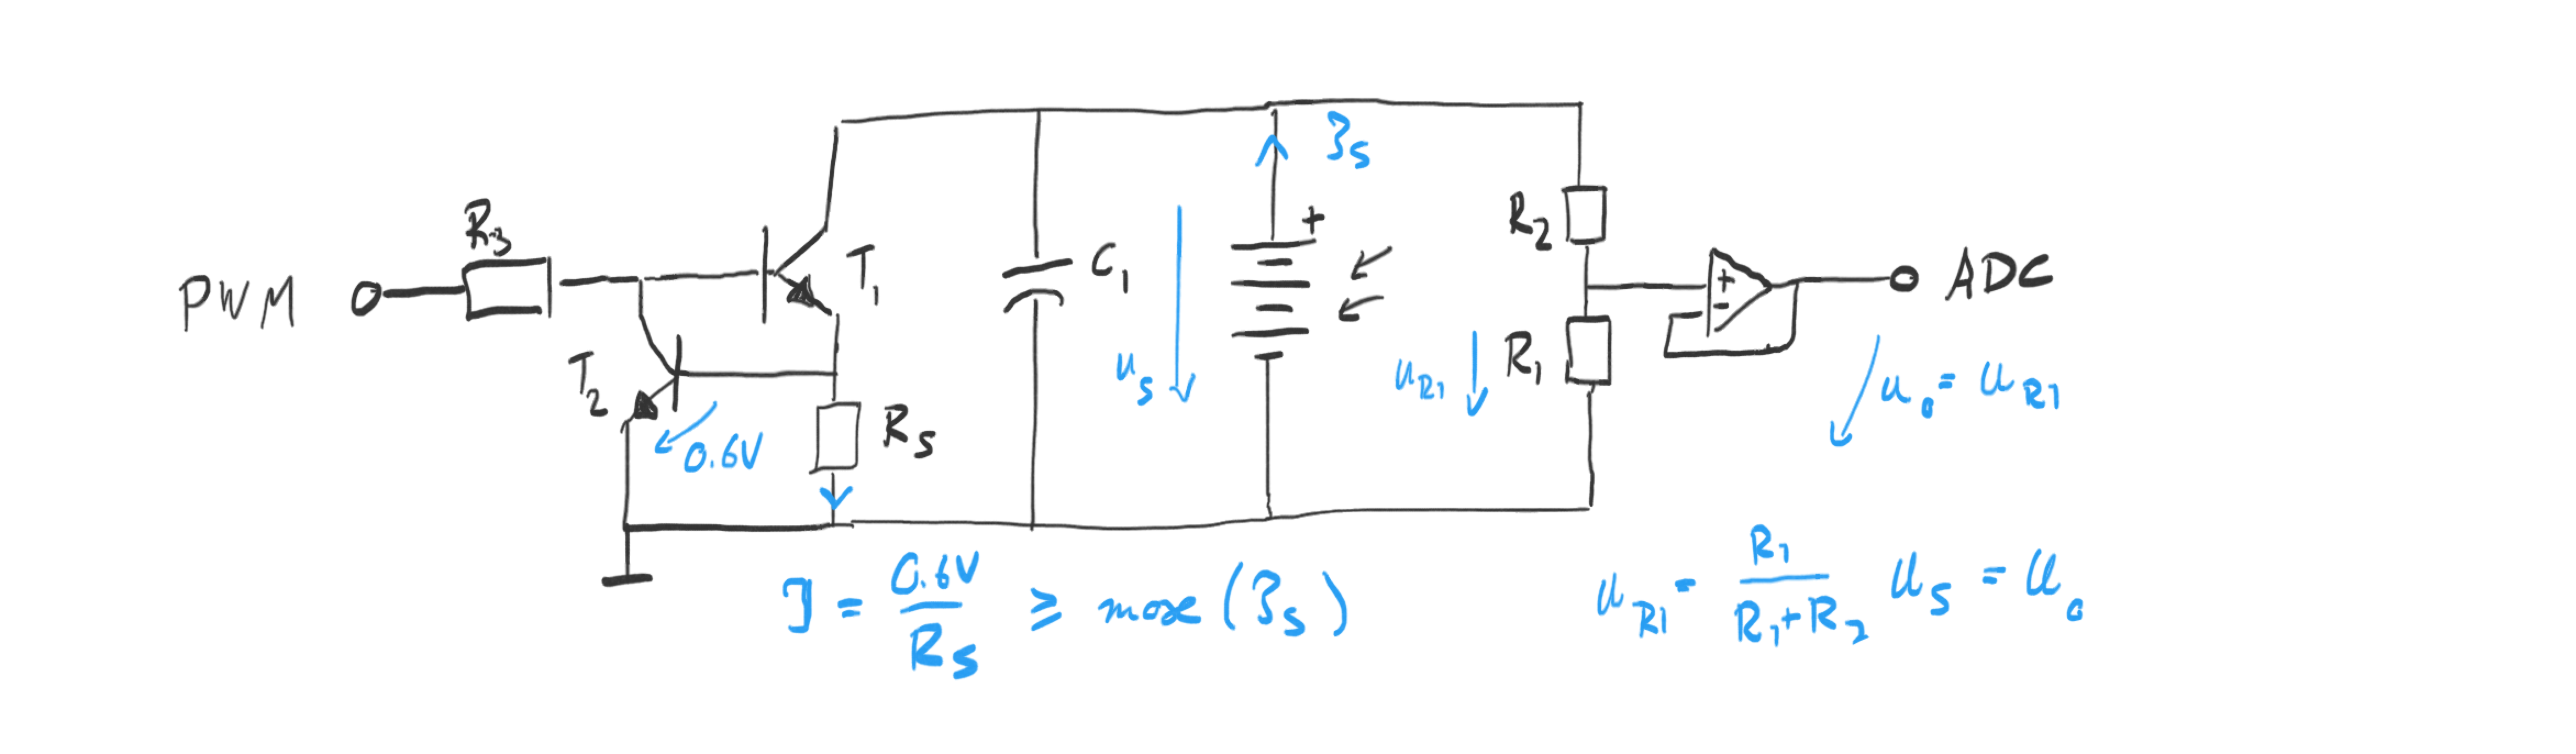
In order to better understand the characteristic of the solar cells, I was using, I built a solar cell characterization system. An Arduino microcontroller generates a variable load using PWM on a solar cell using a variant of a current source circuit: the constant current source is made switchable by the microcontroller as shown below. The simulated load is determined by the duty cycle of the PWM times the set current of the current source. A capacitor in parallel to the solar cell filters the PWM signal so that we can measure the solar cell voltage using a high impedance voltage divider followed by a voltage follower OpAmp to drive the ADC pin of the arduino. High impedance is important so that the measurement circuit dies not impact the solar cell by drawing too much current (especially in low-light and indoor conditions).
To characterize a [relatively small 6V solar cell](), I chose the following part
values:
a voltage divider of
\(R_1 = 4.7M\Omage\)
and
\(R_2=1M\Omega\)
for a total gain of
\(1/5.7\)
which brings the maximum voltage of
\(6V\)
down to
\(0.95V\)
. That maximum
can easily be handled by a LM358 OpAmp in common mode operation (no dual power
supply needed). In common mode the LM358 is not rail-to-rail—it can only go up
to 3.5V for a 5V power supply. In the Arduino we can then use the internal 1.1V
reference voltage.
A load resistor
\(R_S = 100 \Omega\)
which puts the current draw in the full on state
to
\(I = \frac{0.6V}{100\Omega} = 6mA\)
and hence determines the maximum current that can be
drawn. (Sadly) this is plenty for characterization of the solar cell indoors
(outdoors, I would choose
\(10\Omega\)
since the solar cell can go up to 40mA
there). A
\(1k \Omega\)
drives the transistors via the Timer1 PWM signal on the arduino
output pin. Since we use PWM to simulate different loads but at the same time
want to measure the voltage over the solar cell, we need to smooth out the
voltage with a capacitor (
\(100\mu F\)
capacitor worked well). The capacitor forms
a RC-filter with the internal resistance of the solar cell which is in the order
of
\(1k\Omega\)
(as shown below). This puts the RC low-pass filter cut-off
frequency at
\(f_c = \frac{1}{2\pi RC} = 1.6 Hz\)
and the time constant for
charging to
\(\tau = RC = 0.1s\)
. The former nicely smoothes out the PWM
frequencies (which are in the kHz) and the latter means we need to give the
system time to stabilize after changing the PWM duty cycle and especially after
initialization.
The code for solar cell characterization running on the arduino is pretty straight forward. The core code is:
// turn off and let things settle
OCR1A = 0; // PB1 = OC1A = D9
_delay_ms(1000);
for (uint16_t r=0; r<1024; ++r) {
  OCR1A = r;
  // give capacitor time to reach steady state
  _delay_ms(200);
  // current of set point
  float i = ((float)r/1024.f)*0.6f/100.f;
  // collect voltage averaged over 10 samples using a ring-buffer
  Init(&adcs);
  for (uint16_t i=0; i<10; ++i) {
    Insert(&adcs, readAdc(0));
    _delay_ms(10);
  }
  const float u_be = 0.7f;
  const float u_ce = 0.2f;
  float u = toVoltage(MeanFloat(&adcs), 6.27f);
  if (u < u_be + u_ce)
    break;
  // send out over serial
  sprintf(buf, "%f\t%f\n", i, u);
  writeSerialStr(buf);
}
Pin PB1 (or D9 on Arduino) is used as the 10bit PWM output running at $15.625
kHz$. To measure the voltage we use ADC0 with the internal reference voltage of
\(1.1V\)
. Ten ADC samples are averaged to obtain a more stable solar cell voltage
reading. Note also the delays in the loop and before to let the solar cell
output voltage settle. The 200ms delay in the loop are sufficient (despite the
time constant of 100ms), since the current draw only changes by
\(1/1024\)
every
loop iteration which does not change the charge on the capacitor drastically.
Finally, note the one problem with the circuit: we can only measure down to
about
\(0.9V\)
due to the
\(0.7V\)
drop over the load resistor and the
collector-emitter voltage of about
\(0.2V\)
. This could be removed by using a
dual power supply, but I wanted to keep things simple. Since the U-I curve
flattens out in the region of
\(U<0.9V\)
(as you can see from other
characterizations), we are not loosing much information, when using higher
voltage solar cells like the 6V array here. This would become a problem,
if we wanted to characterize individual solar cells or small arrays with open
loop voltages below 3V.
The code above simply stops measuring once the voltage drops below the
threshold of
\(0.9V\)
.
Current and voltage are logged out through serial connection and this can be
recorded and plotted on the computer using the python script contained in the
repository.
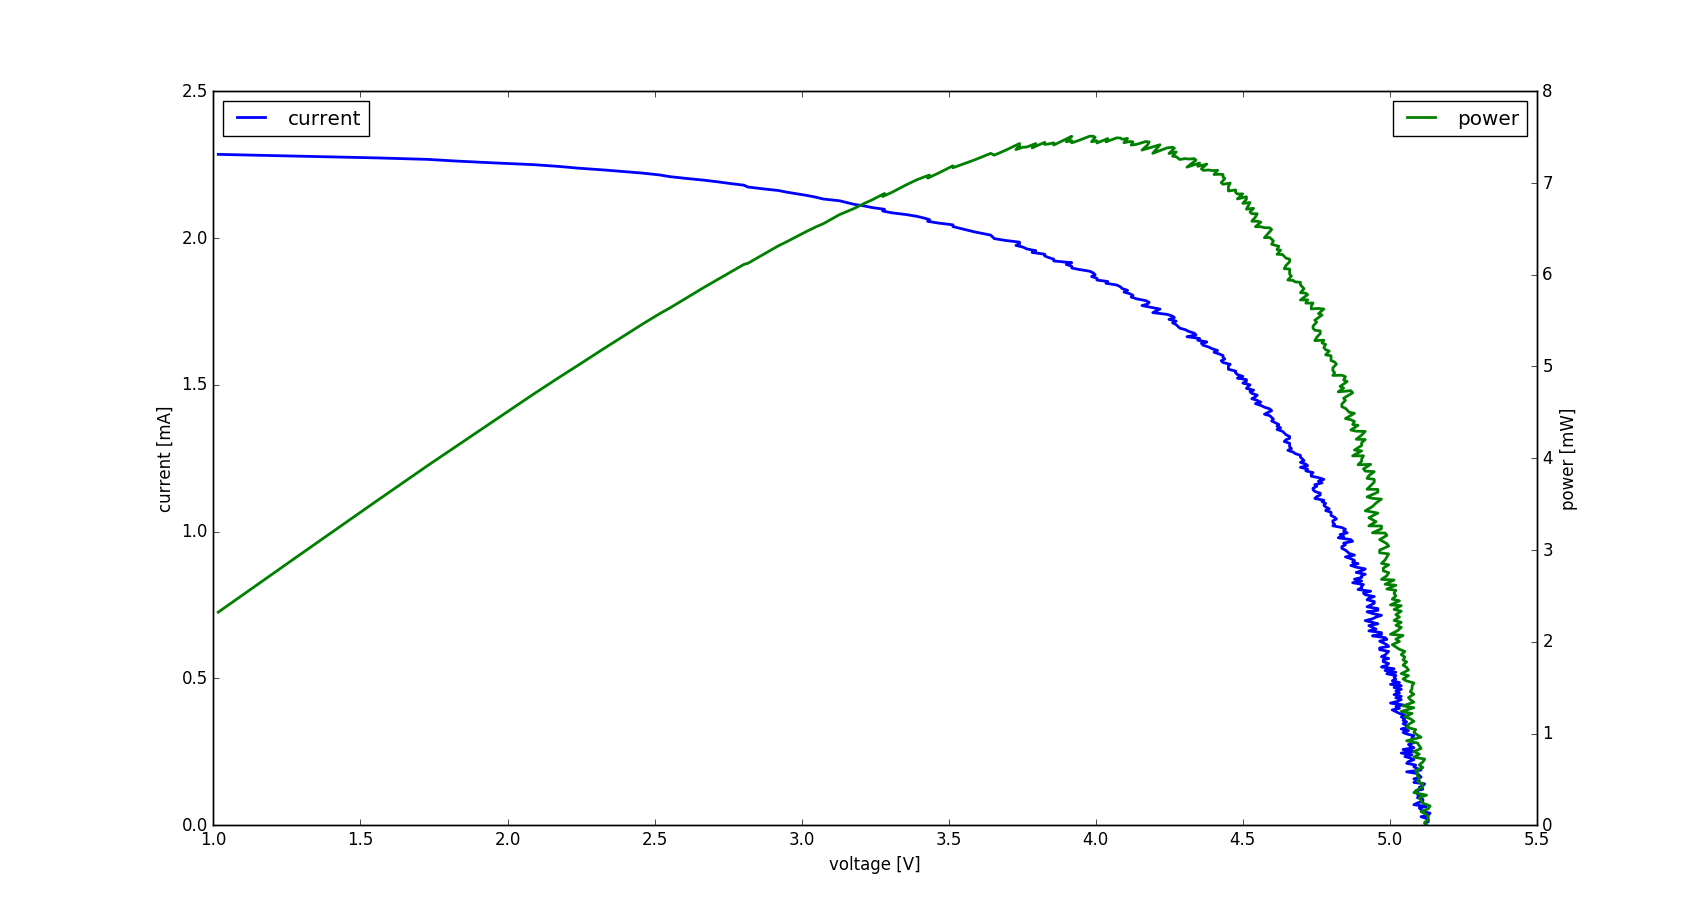
For the
\(6V\)
solar cell array, I got the following two characteristic curves for two different lighting conditions:
Indoor in sunlight:
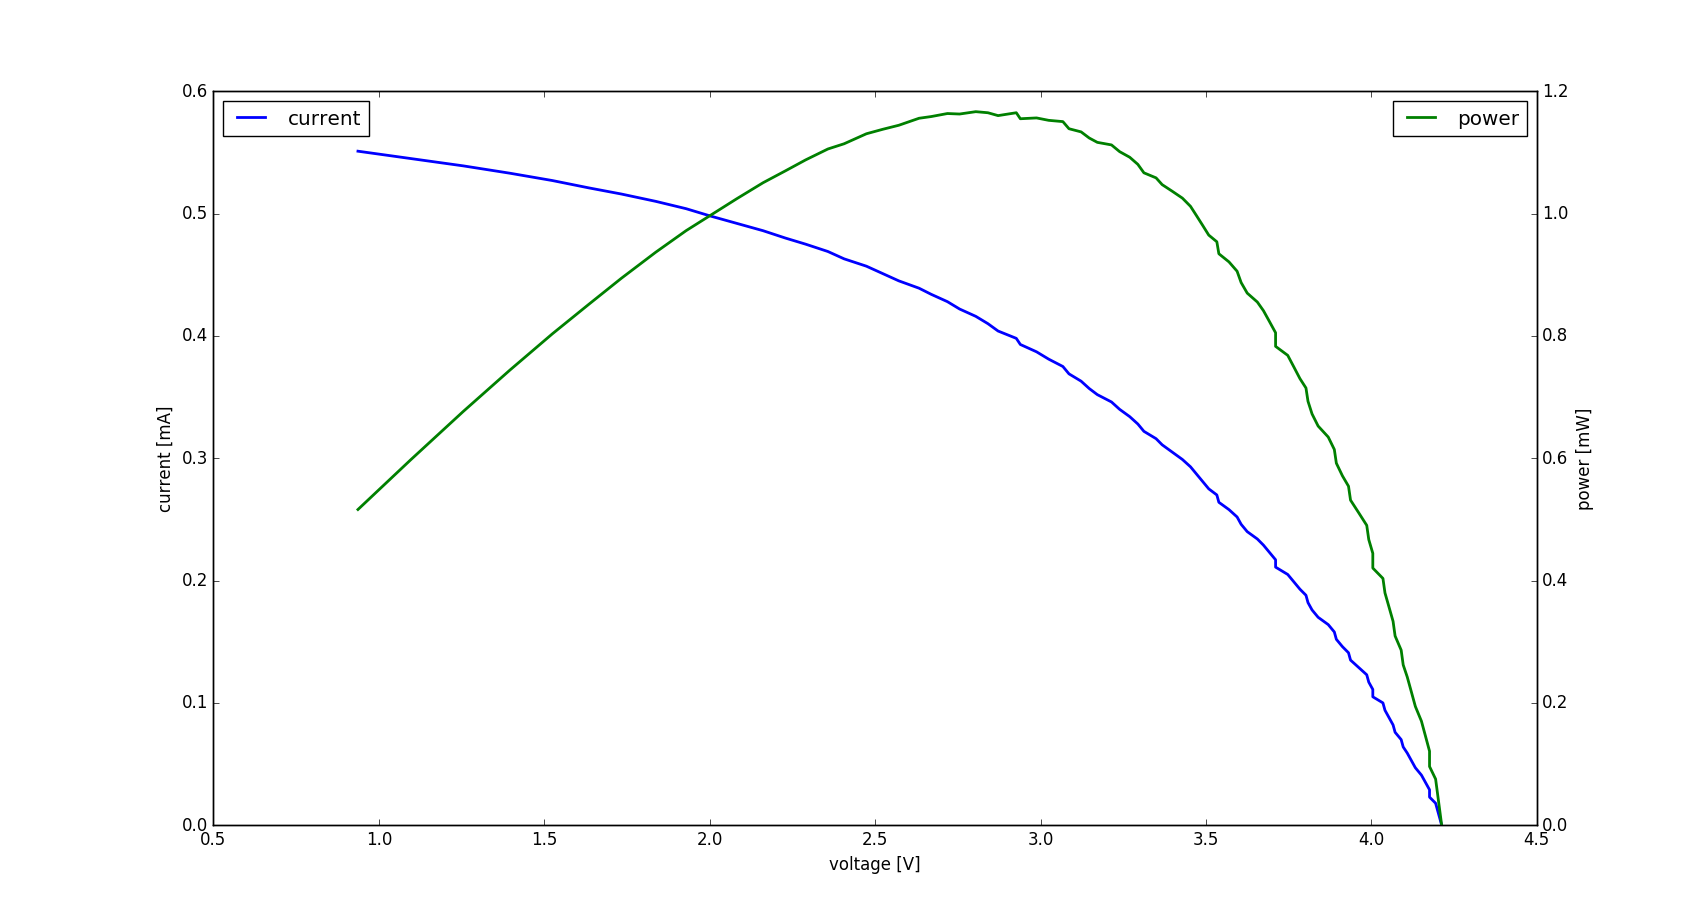
Indoor not in sunlight (just ambient light):
From the characteristic U-I curve, we can compute the series and shunt resistance of the solar cell equivalent circuit shown below via the slopes around the short circuit and the open loop point (left and right end of the curve respectively) (the plotting script does it for you).
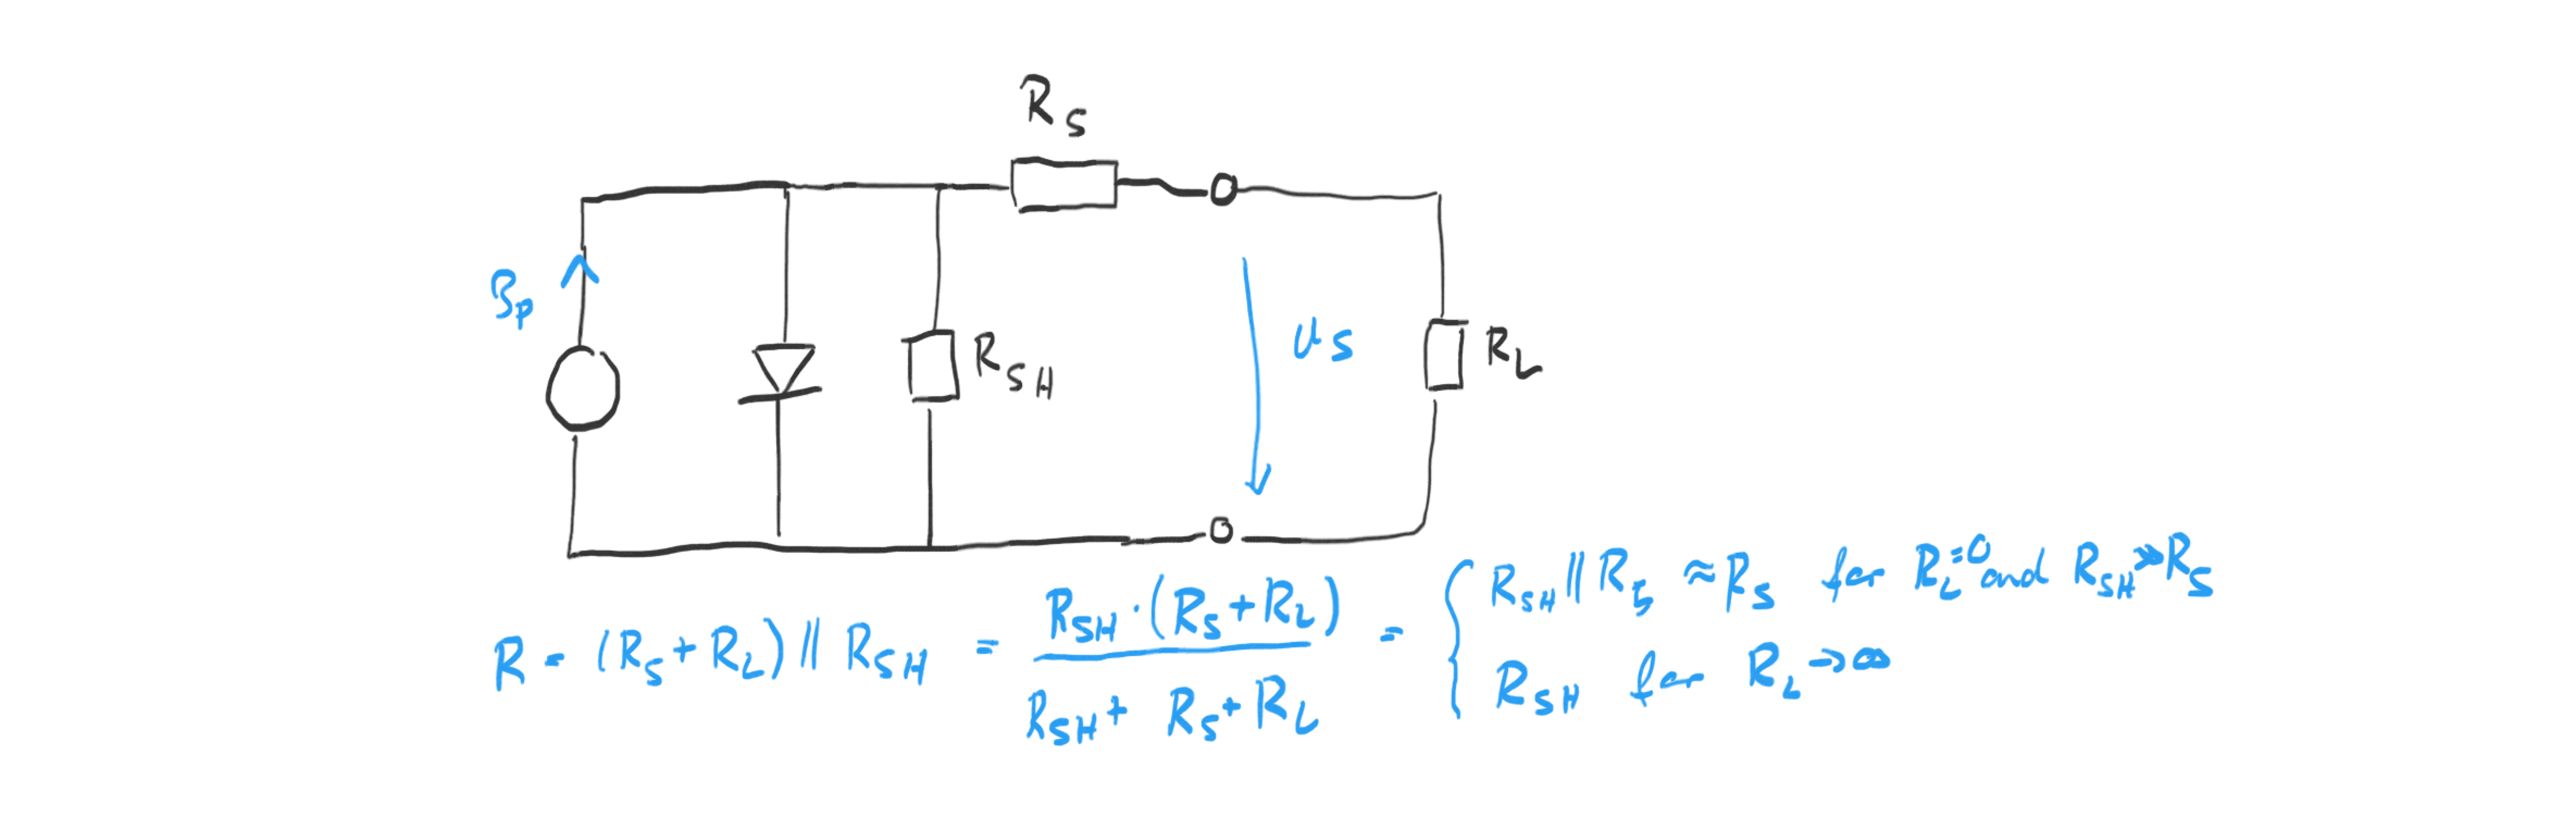
The estimates for this solar cell are: indoor in sunlight
\(R_\text{series}=400\Omega\)
and
\(R_\text{shunt}=25k\Omega\)
and indoor ambient light
\(R_\text{series}=1.5k\Omega\)
and
\(R_\text{shunt}=20k\Omega\)
.
These characteristics are probably best revealed with more light input (also
because of the minimum voltage requirement), so I am going with the estimates
from the characterization under the indoor sunlight.